Last Updated on March 27, 2026 by Becky Halls
Manually creating SEO reports can take up to 40 hours a week, wasting time that could be spent improving rankings or content. Automating your SEO KPI reporting saves time, reduces errors, and delivers real-time insights. Here’s a quick breakdown:
- What It Is: Automating SEO KPI reporting means using tools to compile metrics like traffic, rankings, and conversions into a single dashboard.
- Why It Matters: Saves labor costs (up to $40,500 annually for agencies), improves accuracy, and provides timely alerts for issues like traffic drops.
- Key Tools: Platforms like Google Looker Studio, Databox, and Swydo integrate data from tools like Google Analytics 4, Search Console, and Ahrefs.
- How It Works: Connect data sources, define KPIs, and schedule automated reports. Add real-time alerts for quicker action on critical changes.
Automation helps you shift focus from manual tasks to strategic growth. Let’s explore how to set up the right tools and workflows.
Create Professional SEO Reports in Minutes with n8n Automation

sbb-itb-88880ed
Choosing the Right Tools for SEO KPI Reporting
SEO Reporting Tools Comparison: Features, Pricing, and Best Use Cases
Picking the right tool for SEO KPI reporting can make all the difference when it comes to saving time and ensuring accuracy. A good tool should bring all your SEO platforms together in one place, eliminating the hassle of manually merging data.
Features to Look for in SEO Reporting Tools
Your reporting tool needs to integrate seamlessly with major platforms like Google Analytics 4, Google Search Console, Ahrefs, and SEMrush. These integrations are essential for accurate keyword and backlink analysis. If tracking rankings is part of your strategy, look for tools that work with rank trackers such as AccuRanker.
Customizable dashboards are another must-have. These allow you to focus on the KPIs that matter most – whether that’s organic conversions for an e-commerce site or metrics like impressions and time on page for content-heavy sites. Automation features are also key. Look for tools that can generate reports on a schedule, update data in real time, and distribute reports with a single click. For agencies, white-label SEO reporting is a bonus, as it lets you customize reports with your branding, adding a professional touch to client deliverables.
Lastly, make sure your tool offers KPI-specific analytics. It should automatically track metrics like keyword rankings, backlink quality, traffic sources, bounce rates, and conversions without requiring a lot of manual setup. For example, if you’re running link-building campaigns through platforms like 3Way.Social, which uses AI for backlink exchanges and tracks metrics like Domain Authority, your reporting tool should integrate with Ahrefs or SEMrush to pull in these KPIs automatically.
Comparing Popular SEO Reporting Tools
Here’s a closer look at some top tools to help you decide which one suits your needs:
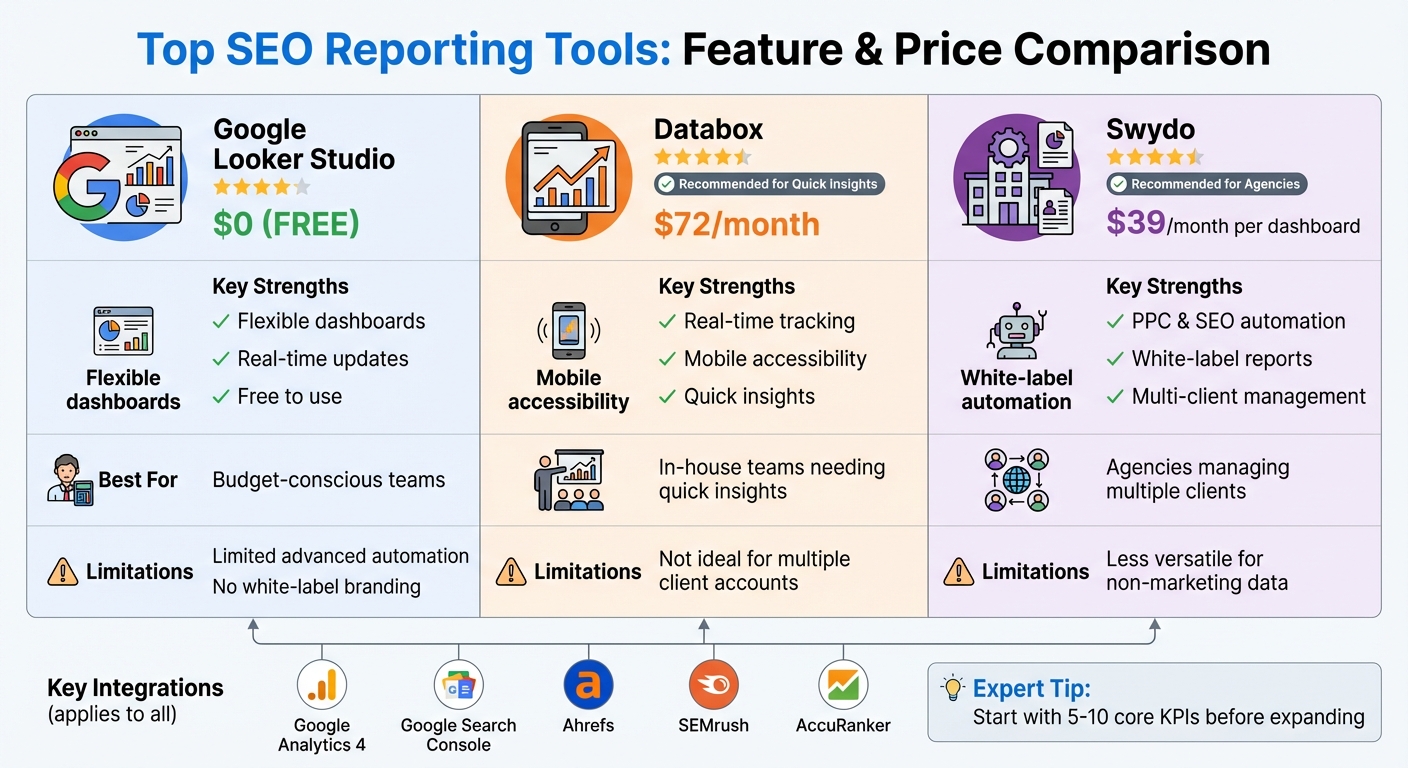
- Google Looker Studio: This free tool offers customizable dashboards and real-time updates, making it ideal for teams on a tight budget. However, it might lack advanced automation and branding options that agencies often require.
- Databox: Known for its real-time dashboards and mobile accessibility, Databox is a solid choice for in-house teams. Starting at $72/month, it’s great for quick insights but may not be the best for managing multiple client accounts.
- Swydo: With features like PPC and SEO tracking, automated reports, and white-label options, Swydo is perfect for agencies. Plans start at $39/month per dashboard, though it may not be as versatile for non-marketing data.
| Tool | Key Strengths | Starting Price (USD) | Best For |
|---|---|---|---|
| Google Looker Studio | Flexible dashboards, real-time updates, free | $0 | Budget-conscious teams |
| Databox | Real-time tracking, mobile access | $72/month | In-house teams needing quick insights |
| Swydo | PPC/SEO automation, white-label reports | $39/month per dashboard | Agencies managing multiple clients |
When trying out these tools, take advantage of free trials to test how well they handle automation. Experts suggest starting with 5–10 core KPIs – like organic traffic, keyword rankings, and conversions – before adding more as your workflow evolves. If backlinks are part of your focus, ensure your chosen tool integrates with platforms like Ahrefs or SEMrush to track metrics like link quality and domain authority with ease.
Integrating Data Sources for Complete Reporting
Main SEO Data Sources to Connect
To get a full picture of your SEO performance, you’ll want to bring together data from three major sources. Google Search Console (GSC) offers insights into search visibility, tracking metrics like clicks, impressions, click-through rates (CTR), and keyword rankings. Pair that with Google Analytics 4 (GA4), which dives into visitor behavior – covering traffic sources, bounce rates, session durations, and conversions. Finally, backlink tools like Ahrefs or Semrush are essential for monitoring off-page SEO efforts, keeping tabs on new and lost backlinks.
When you integrate these sources, you can link search rankings, user engagement, and link-building activities into a cohesive story. This integration ensures your automated dashboard stays accurate and consistent, providing real-time insights. For example, if you’re managing link-building campaigns with a tool like 3Way.Social, it should automatically pull in backlink KPIs. This allows you to track key metrics like Domain Authority and ensure links maintain their follow and nofollow status – giving you immediate feedback on your campaign’s effectiveness.
How to Connect Data Sources
Once you’ve identified your data sources, the next step is to connect them securely and efficiently. Most modern reporting tools simplify this process with built-in integrations that don’t require coding.
To connect Google Search Console, log into your reporting tool, head to the integrations section, select GSC, and sign in with your Google account. From there, choose the properties to link, map the metrics you need (like clicks, impressions, and average position), and set up a refresh schedule – whether daily or weekly – for automatic updates.
The steps for GA4 are similar: authenticate using Google OAuth, select the properties you want to track, pick key metrics (such as organic traffic and conversions), and enable auto-refresh settings. For backlink tools like Ahrefs or Semrush, you’ll need to generate an API key, input it into your reporting tool, select your projects and metrics, and schedule daily data imports.
If you’re looking for a tool to combine all this data seamlessly, platforms like Coupler.io are a great option. They allow you to merge GSC impressions, GA4 conversions, and backlink data from Ahrefs into a single, unified dashboard – making it easier to spot trends and correlations at a glance.
Building and Automating SEO KPI Workflows
This workflow expands on the integrated tools mentioned earlier by simplifying data delivery and ensuring proactive monitoring.
Automating Report Generation
Once your data sources are connected, the next step is to schedule automated report generation and delivery. Most reporting platforms allow you to set up weekly or monthly schedules for creating and sharing reports. The frequency you choose should match your campaign’s activity level – weekly reports are ideal for campaigns needing close monitoring, while monthly reports are better suited for reviewing long-term strategies.
Automation significantly cuts down the time spent on reporting. Tools like Google Search Console, GA4, and backlink trackers can pull live data at scheduled intervals. This data is then compiled into a formatted report and sent directly to stakeholders, keeping everyone updated without requiring manual effort.
For those managing link-building campaigns with platforms like 3Way.Social, automated dashboards make monitoring seamless. These dashboards provide real-time updates on your backlink portfolio and overall SEO progress. They track the status of your backlinks, ensuring they remain active and retain their “do-follow” status. This data integrates directly into your scheduled reports, giving you metrics like Domain Authority and link health alongside traffic and ranking updates – automatically and effortlessly.
With reporting taken care of, you can focus on setting up real-time alerts to catch and address issues as they happen.
Setting Alerts for Key Metrics
Automated alerts act as your SEO safety net, helping you catch potential problems before they escalate. Setting up real-time notifications ensures you’re immediately aware of critical issues like traffic declines, crawl errors, or accidental “noindex” tags on important pages. This is crucial, especially since 75% of search engine users never go beyond the first page of results.
To make alerts effective, define clear thresholds for triggering notifications. For instance, you could set an alert for a 10% drop in organic traffic within 24 hours or a notification if a high-value keyword drops more than five positions. These alerts can be sent via Slack, email, or directly into your CRM, making sure they’re seen and acted upon promptly.
“Automated reports are only as good as the data sources and metrics you choose to include, so getting those decisions right upfront is the real work”.
The same goes for alerts: prioritize metrics that require immediate action rather than reacting to every small fluctuation. This focus ensures that your monitoring efforts stay efficient and actionable.
Best Practices for SEO KPI Reporting
Automated workflows and integrated data are just the start – effective SEO KPI reports need to prioritize clarity and actionable insights to truly impact business outcomes. Agencies spend an average of 12–15 hours each month creating manual reports, so setting up automation properly from the beginning can save time and effort. The ultimate goal? Dashboards and metrics that stakeholders actually use, with a clear connection to revenue.
Designing Clear Dashboards
Your dashboard should anticipate and answer stakeholder questions. Start with an executive scorecard at the very top, summarizing key metrics like organic revenue, assisted conversions, and cost per opportunity. Underneath, organize the data into sections that focus on different aspects of performance:
- Acquisition: Traffic breakdown by source.
- Visibility: Keyword rankings and SERP features.
- Experience: Core Web Vitals and conversion rates.
How you present the data matters just as much as the data itself. Avoid overwhelming stakeholders with rows of numbers; instead, use charts and graphs to highlight trends at a glance. For a seamless experience, integrate data from tools like Google Analytics 4 (GA4), Google Search Console, and PageSpeed Insights, so stakeholders don’t have to juggle multiple platforms.
“Our clients care most about rank. For us, that’s only part of the story; we get them to also look at how rank translates to traffic and conversions.” – Scott Gingrich, Chief Marketing Strategist, GravityStack Marketing
Professionalism also plays a role. Add white-label elements like custom logos and brand colors to give your reports a polished look. If link-building is part of your strategy, include metrics such as Domain Authority improvements, link health, and do-follow verification through tools like 3Way.Social. These can be integrated into the visibility section for easy tracking.
Once your dashboard is visually clear, the next step is to tie these insights to real business outcomes.
Connecting Metrics to Business Results
Metrics only matter when they’re tied to business goals. Executives don’t care about keyword rankings in isolation – they want to know how those rankings affect revenue. Always lead with business outcomes like organic-attributed revenue, lead volume, and market share.
Think of rankings and traffic as “leading indicators” that show progress, while conversions and revenue are the “lagging indicators” that reflect actual results. For example, if your site attracts 50,000 organic visitors monthly from keywords with an average PPC value of $3.50 per click, that’s equivalent to $175,000 in advertising value.
Focus on metrics that highlight business value. Instead of reporting “total keywords ranked”, emphasize “keywords in positions 1–10 for target queries” to show first-page visibility – especially since 75% of users never scroll past the first page. Segment organic sessions by intent (e.g., high-intent vs. informational) to demonstrate how traffic aligns with business goals.
“A report with one clear insight and one concrete recommendation gets acted on. A report with fourteen data points and no recommendation gets filed.” – IndexCraft
Tailor the frequency of your reports to the audience. Executives might only need a one-page monthly summary with revenue highlights and a strategic recommendation, while SEO teams benefit from live dashboards tracking crawl health and ranking changes weekly. Content teams, on the other hand, may require quarterly reviews focusing on content performance and decay. This tiered approach ensures each group gets the right information without being overwhelmed.
Finally, ensure everyone speaks the same language when it comes to metrics. A shared data dictionary can help align definitions for terms like “non-brand traffic” or “assisted conversions”. When everyone understands the metrics in the same way, decision-making becomes faster and more effective. With the marketing automation software market growing at 13.3% annually through 2030, more teams will rely on these systems – standardized definitions will be key to keeping everyone on the same page.
Conclusion
Automation slashes reporting time from 12–15 hours a month to just 6–8 minutes, cutting out manual errors and enabling real-time alerts. This shift frees up time and energy for high-value tasks like content creation and client engagement.
To get started, connect essential data sources like Google Search Console (GSC) and Google Analytics 4 (GA4). Define KPIs that align with your goals and set up a branded automated report. Test its accuracy for about four weeks before expanding its use. This approach doesn’t just save time – it also delivers measurable cost savings.
“Automated reports are only as good as the data sources and metrics you choose to include, so getting those decisions right upfront is the real work.” – Allan de Wit, RankYak
The financial benefits are undeniable. For example, a 15-client agency could save around $3,150 a month in labor costs, assuming a $75/hour rate. Automation not only saves money but also increases client capacity without requiring additional staff. Plus, it shifts your focus from analyzing past data to planning future strategies.
If link-building is part of your SEO plan, consider adding metrics like Domain Authority changes and do-follow link verification. Tools like 3Way.Social can help you track backlink health alongside organic performance data. With the tools, workflows, and strategies outlined here, you can build automation systems that let your team concentrate on what drives real growth.
FAQs
Which SEO KPIs should I automate first?
Automating critical SEO metrics such as organic traffic, keyword rankings, bounce rate, and organic conversions is a smart starting point. These metrics provide a clear picture of your website’s performance and help pinpoint areas that need attention. By automating their tracking, you not only save time but also ensure consistent, hassle-free monitoring without the need for manual data collection.
How do I ensure GA4 and Search Console data match?
To make sure data from Google Analytics 4 (GA4) and Search Console aligns properly, it’s crucial to connect the platforms correctly and maintain consistent tracking practices. Start by verifying that both tools are set to monitor the same properties and use identical date ranges. Also, double-check any filters or segments applied in each platform to ensure they match.
Keep in mind that Search Console has some limitations when it comes to data collection. For example, its interface caps data at 1,000 rows. However, the Search Console API can provide access to full query data, allowing for more in-depth analysis. Regularly reviewing your settings in both tools can help reduce discrepancies and ensure your data remains as accurate as possible.
What alert thresholds should I set for SEO changes?
To effectively monitor your SEO performance, it’s crucial to establish alert thresholds tailored to your typical metrics and the sensitivity of your data. Some common thresholds to consider include:
- A 10–20% drop in organic traffic
- Sudden drops in keyword rankings
- Noticeable fluctuations in backlinks
These benchmarks aren’t one-size-fits-all. Use your historical data and industry norms to fine-tune them. Regularly review and adjust these thresholds to ensure they remain relevant for spotting significant SEO changes. This way, you can act quickly and stay ahead of potential issues.