Last Updated on May 6, 2026 by Becky Halls
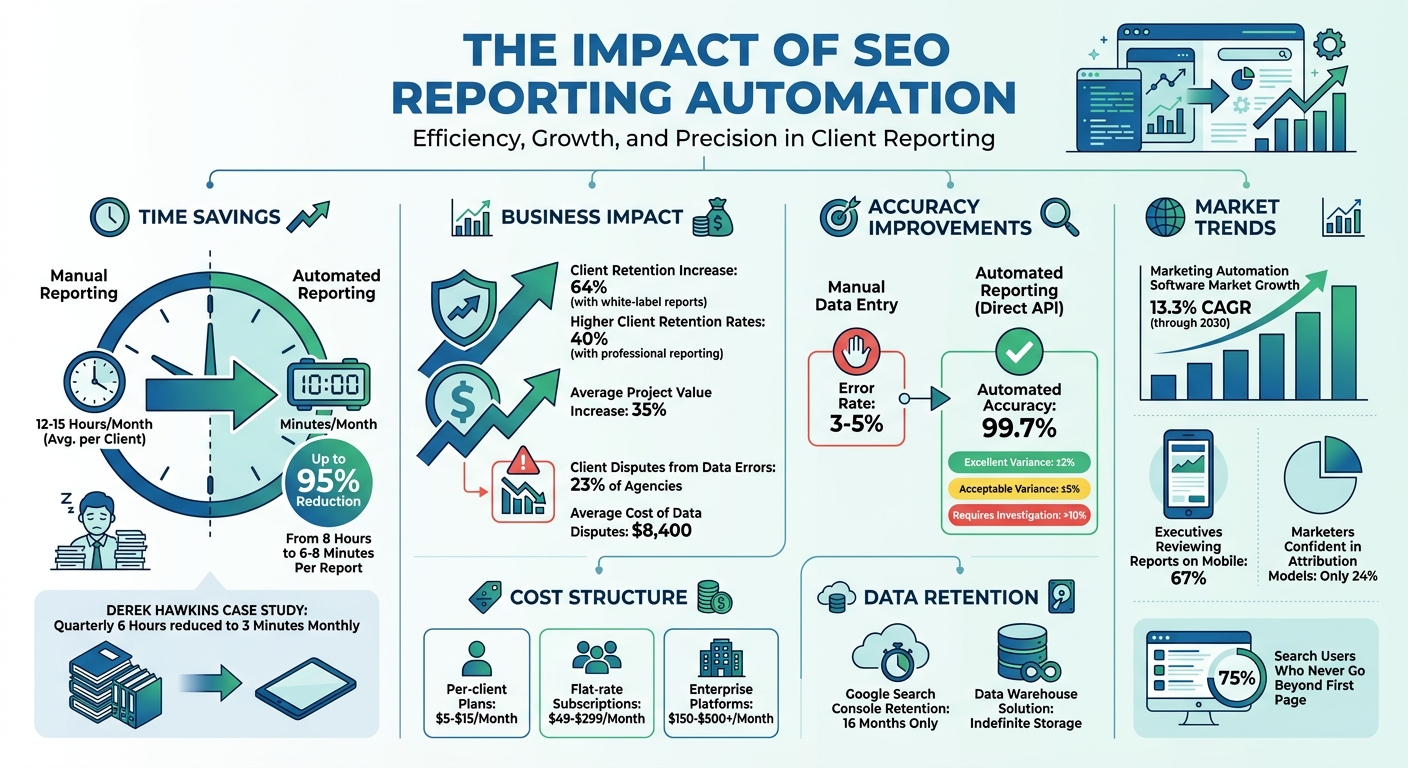
SEO reporting can take up to 15 hours monthly per agency, but automation reduces this to just minutes. By integrating tools like Google Analytics 4, Google Search Console, and platforms like Looker Studio or Semrush, agencies save time, cut errors, and improve client retention by 64%. Automation also enables real-time alerts for traffic drops or ranking changes, ensuring quicker responses to issues. Here’s how to streamline your SEO reporting process:
- Use API-integrated tools to eliminate manual data exports.
- Centralize data with warehouses like Google BigQuery for long-term storage.
- Build reusable templates for consistent reporting across clients.
- Set up anomaly alerts for immediate issue detection.
- Incorporate backlink tracking tools like 3Way.Social for domain authority insights.
Automation not only saves time but also ensures accuracy, clearer insights, and stronger client relationships. Read on to learn the tools, workflows, and strategies to transform your reporting process.
SEO Reporting Automation Benefits and Statistics
Create Professional SEO Reports in Minutes with n8n Automation
sbb-itb-88880ed
Choosing the Right SEO Reporting Tools
The right SEO reporting tool can save you hours of work, while the wrong one can lead to frustrating delays. A tool with direct API integrations is a must – it should seamlessly connect to platforms like Google Search Console, Google Analytics 4 (GA4), and PageSpeed Insights. This eliminates the need for manual CSV exports or third-party tools, streamlining your reporting process.
For agencies, white-labeling SEO reports is more than just slapping a logo onto a report. High-quality tools let you customize color schemes, use dedicated domains (e.g., reports.youragency.com), and completely remove third-party branding. Why does this matter? Studies show that clients perceive white-labeled reports as 73% more professional, and agencies that use them report a 64% boost in client retention.
The best tools also go beyond the basics. Look for features like automated report delivery via email or Slack, the ability to blend metrics (e.g., combining GA4 traffic data with keyword rankings), and scalability for multiple users. Advanced options like AI-powered anomaly detection can alert you to sudden performance changes. For example, if organic traffic drops by more than 20% in a week, the system can notify your team instantly via email or Slack, so you can act quickly. And since 67% of executives review reports on their smartphones, mobile-friendly designs are non-negotiable.
Pricing varies widely depending on the tool. Per-client plans typically cost between $5 and $15 per client per month, while flat-rate subscriptions range from $49 to $299 monthly for unlimited reporting. Enterprise-level platforms often start at $150 per month and can go beyond $500, usually including perks like dedicated account management and custom integrations.
Now that we’ve covered the must-have features, let’s dive into the tools that form the backbone of automated SEO reporting.
Core Tools for SEO Reporting Automation
Google Search Console (GSC) and GA4 are essential for automated reporting. GSC provides data on keyword rankings, impressions, and click-through rates, but it only retains data for 16 months. Automated tools that include data warehousing can help you work around this limitation. GA4, on the other hand, delivers insights into traffic, conversions, and user behavior. Proper setup – like filtering out internal traffic – is critical to ensure accurate data.
Some tools also offer deeper insights, including competitor analysis and backlink tracking. For example:
- Semrush: An all-in-one marketing platform with features like a drag-and-drop PDF report builder.
- Ahrefs: Known for its extensive backlink index and tools for technical SEO and authority tracking.
- Looker Studio (formerly Google Data Studio): Free for Google-native data sources, offering endless custom visualization options.
- Databox: Specializes in executive KPI monitoring with mobile-friendly dashboards and pre-built templates.
A real-world example? In July 2019, Derek Hawkins, SEO Manager at Domino Data Lab, used Python along with APIs from SEMrush and Google Search Console to automate reporting. By tracking metrics like top 10 keyword positions, SERP click-through rates, and backlinks, his team slashed quarterly reporting time from six hours to just three minutes per month. This freed up time for more strategic tasks.
“Our clients care most about rank. For us, that’s only part of the story; we get them to also look at how rank translates to traffic and conversions. AgencyAnalytics is a big part of having conversations with our clients.”
– Scott Gingrich, Chief Marketing Strategist, GravityStack Marketing
When choosing tools, focus on Time to Value (TTV). Tools with pre-built templates and one-click authentication can get you up and running in under an hour. Use RegEx filters to exclude branded search terms for a clearer view of your SEO impact, and ensure the tool handles API rate limits to avoid data gaps during high traffic periods.
Beyond these core tools, platforms like 3Way.Social can take your reporting to the next level by enhancing your backlink strategy.
How 3Way.Social Supports Automated SEO Reporting
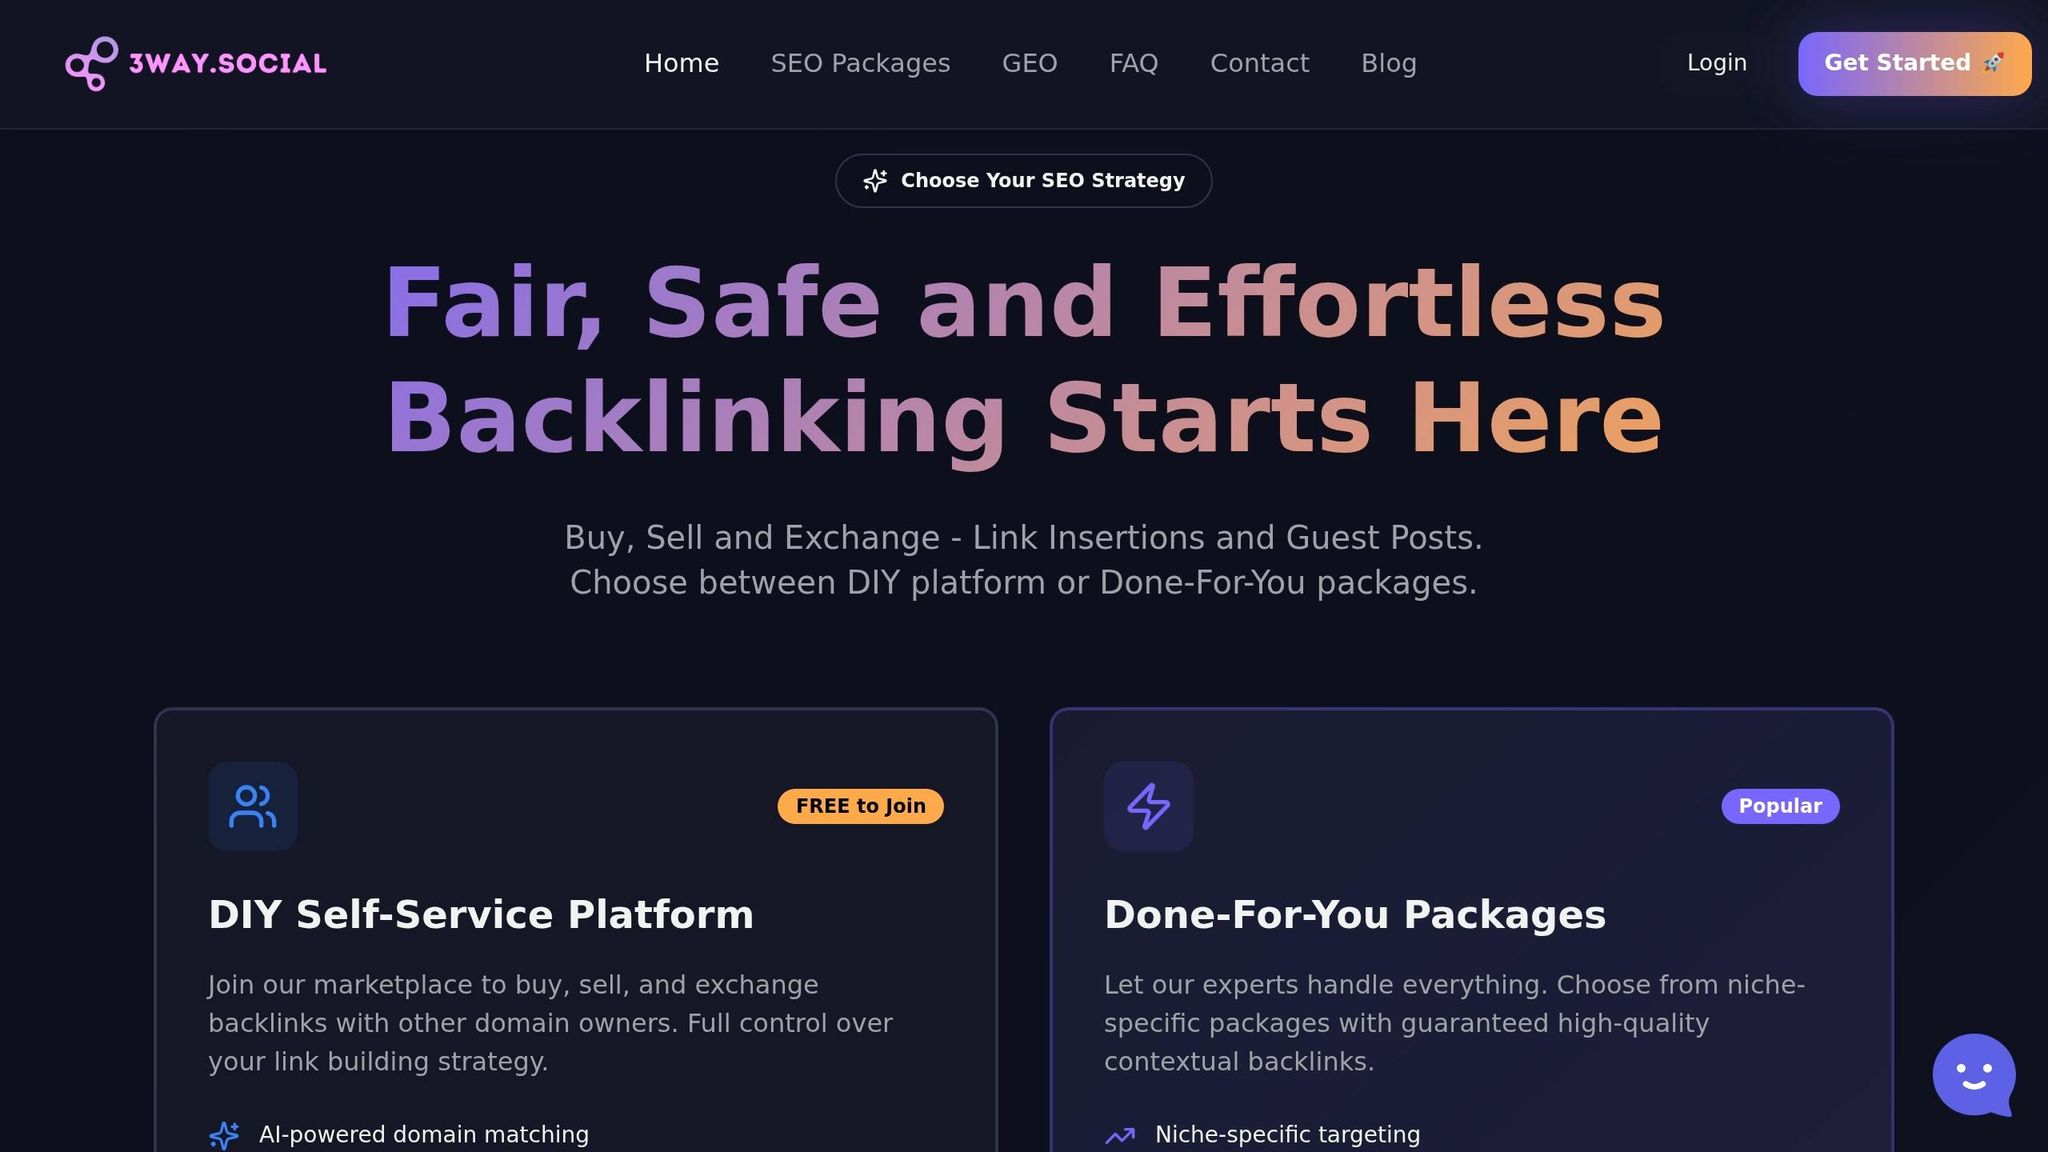
While core tools track performance metrics, 3Way.Social adds value by improving your backlink profile and boosting domain authority. The platform uses AI to match you with vetted SEO professionals for ABC link exchanges, ensuring high-quality connections that focus on relevance rather than quantity.
Automated reports often reveal gaps in backlink acquisition or stagnant domain authority. 3Way.Social addresses these issues by offering permanent do-follow links and advanced link diversification strategies. Its domain-matching feature ensures you’re connecting with reputable, high-authority sites – helping you avoid low-quality link farms that could harm your rankings.
For agencies juggling multiple clients, 3Way.Social simplifies the process of building authoritative backlinks at scale. Its guest posting capabilities and trusted network streamline link building, so the improvements you see in your reports – higher domain authority, more referral traffic, and better keyword rankings – happen without manual outreach.
The platform also integrates seamlessly into your broader SEO strategy, answering the critical “what’s next?” question. By focusing on improving backlink quality and key metrics, 3Way.Social complements your automated reporting stack and helps you make data-driven decisions.
Setting Up Centralized Data Integration
Once you’ve chosen your tools, the next step is to centralize your data using direct API connections. This method simplifies data collection by pulling information from various platforms into one place, eliminating the hassle of manual CSV exports. The result? Your reports stay accurate and up to date without constant manual intervention.
The marketing automation software market is expanding at a 13.3% CAGR through 2030, yet only 24% of marketers feel confident in their attribution models. A big reason for this disconnect is fragmented data. When platforms like Google Search Console, GA4, and rank trackers each use different naming conventions and date formats, it becomes almost impossible to get a clear view of performance.
By using direct API connections, you can automate the syncing of data from tools like Google Search Console, GA4, and SEMrush. As Marc Caposino, CEO of Fusedash, puts it:
“If you’re exporting a CSV and then uploading it somewhere else, you haven’t automated the data layer. You’ve just moved the manual step”.
For businesses looking to grow over time, a data warehouse like Google BigQuery is a smart choice. Unlike native tools such as Google Search Console, which only retain data for 16 months, a data warehouse keeps your information indefinitely. This makes it easier to compare performance year-over-year and uncover trends that would otherwise be lost.
Before integrating, it’s crucial to audit your data sources. For example, ensure GA4 filters out internal IP traffic and that conversion tags are functioning properly. Poor-quality data can lead to compounding errors down the line.
Centralizing your data lays the groundwork for consistent reporting and smoother analysis across all platforms.
Creating Consistent Naming Conventions
When managing data across multiple tools, standardized naming conventions are key. They allow you to scale your reporting templates without having to rebuild layouts for each client.
Start by developing a shared data dictionary. This document defines every metric – such as what qualifies as a “non-brand” visit, how to calculate organic conversion rates, and which attribution windows to use. When everyone interprets metrics the same way, confusion is reduced, and client trust improves.
Next, align your “joining keys.” For example, landing page URLs and date formats must match across tools. If GA4 uses “YYYY-MM-DD” while another platform uses “MM/DD/YYYY”, your data blending will fail. Standardizing these details ensures your comparisons remain consistent.
You can also apply RegEx filters to maintain consistency. For example, excluding branded search terms across all reports can help isolate true organic growth and minimize discrepancies between tools.
Lastly, double-check Property IDs when connecting APIs. GA4’s naming conventions can be tricky, and even a minor mismatch could disrupt your entire dashboard.
With consistent naming conventions in place, you’ll be able to merge metrics seamlessly and connect data across platforms with ease.
Connecting Data Across Tools
Once your naming conventions are standardized, use common identifiers like landing page URLs or dates to link data from various sources. For example, you can connect Google Search Console query data to GA4 revenue metrics by matching landing page URLs. This unifies your insights and provides a clearer picture of performance.
For those heavily reliant on Google tools, Looker Studio is a popular choice. It connects directly to native data sources like GA4 and Google Search Console for free. However, integrating non-Google platforms often requires paid third-party connectors. Some reporting tools also offer pre-built templates and one-click authentication options, but these conveniences may come with higher monthly fees.
To stay on top of issues, set up anomaly alerts. For instance, if organic traffic drops by more than 20% week-over-week, automated notifications via email or Slack can help you investigate and address the problem quickly.
You can also integrate tools like 3Way.Social into your system. By tracking metrics such as backlink acquisition, domain authority growth, and referral traffic from link exchanges, you can measure the impact of your link-building efforts alongside other SEO metrics. This integrated approach gives you a more complete view of what drives rankings and traffic.
| Integration Layer | Purpose | Tools/Methods |
|---|---|---|
| Data Extraction | Pulling raw metrics | APIs (GSC, GA4), ETL connectors |
| Storage | Retaining historical data | Data warehouses (e.g., Google BigQuery) |
| Normalization | Standardizing identifiers | Shared data dictionary, URL mapping |
| Visualization | Reporting and analysis | Custom dashboards (e.g., Looker Studio) |
| Governance | Ensuring data quality | Anomaly alerts, data-quality checks |
Building Scalable Report Templates
Once your data is centralized and standardized, the next step is to create reusable templates that generate reports in minutes. Agencies using professional reporting systems often experience 40% higher client retention rates and see 35% higher average project values. These templates not only save time but also ensure consistency across reports.
The secret to scalability lies in a modular design. Start with a master template that includes interchangeable sections, such as traffic, keywords, and backlinks, which automatically update through API connections. When onboarding a new client, you simply apply the template and adjust the data sources. This method allows agencies to take on more clients without a matching increase in work hours.
Manual reporting is time-consuming and prone to errors, whereas automated solutions can produce the same results in just minutes. Even small mistakes can snowball, making automation critical for maintaining accuracy. The trend is also shifting from static monthly PDFs to real-time dashboards that clients can access anytime. This “always-on” approach keeps clients informed and demonstrates your agency’s transparency and commitment to data-driven decisions.
These templates build upon centralized data integration, ensuring reports are consistent and can be deployed quickly for any account.
Key Components of an SEO Report
A modular template not only speeds up reporting but ensures every report includes the essential metrics that matter to clients. By linking technical data to real-world business outcomes, you can create reports that resonate with stakeholders. A strong Executive Summary is especially crucial, focusing on how SEO efforts drive revenue and ROI rather than just listing traffic stats. After all, stakeholders care most about how SEO impacts leads and sales.
Your template should include the following components:
- A Traffic Overview showing organic sessions, users, and page views, with comparisons month-over-month or year-over-year to highlight seasonal trends.
- Keyword Performance, tracking rankings for target queries, noting position changes, and spotlighting new top-10 entries – important since 75% of search users never go beyond the first page.
- Technical SEO Health, which monitors crawl errors, indexation issues, and Core Web Vitals (LCP, FID, CLS) to ensure the site performs well for search engines.
- A Backlink Profile, detailing newly acquired links and their quality using metrics like Domain Authority or Page Score.
- Conversion Metrics, connecting SEO efforts to business goals by tracking leads, e-commerce transactions, and completed goals.
“Our clients care most about rank. For us, that’s only part of the story; we get them to also look at how rank translates to traffic and conversions.” – Scott Gingrich, Chief Marketing Strategist, GravityStack Marketing
Adding Competitive Benchmarks is also valuable, as it provides context by comparing your client’s performance to their competitors. This helps stakeholders see how their efforts stack up in the broader market.
| Report Component | Metrics | Source |
|---|---|---|
| Executive Summary | ROI, Revenue, Lead Quality, Key Wins | Blended Data (GA4 + CRM) |
| Organic Traffic | Sessions, New Users, Bounce Rate, MoM Change | Google Analytics 4 |
| Search Visibility | Clicks, Impressions, CTR, Average Position | Google Search Console |
| Keyword Rankings | Top 10 Positions, Ranking Volatility, New Keywords | Rank Tracking APIs (SEMrush/Ahrefs) |
| Technical Health | Core Web Vitals, Indexation Errors, Site Speed | GSC / PageSpeed Insights |
| Backlinks | New Referring Domains, Link Quality/Authority | Moz / SEMrush / Ahrefs API |
3Way.Social Plans for Reporting Integration
Integrating 3Way.Social into your reporting setup can further enhance these templates by seamlessly incorporating high-quality backlink data. The platform offers flexible plans that work with your existing SEO tools, pulling in metrics like backlink acquisition, domain authority growth, and referral traffic directly into your reports.
- The Free Plan ($0/month) provides basic tracking for new backlinks and referral traffic, making it an easy way to start monitoring link-building efforts at no cost.
- The Starter Plan ($20/month) is ideal for agencies managing multiple clients. It includes advanced filters to segment link-building performance by campaign, domain, or date range, enabling more tailored client reporting.
- The Pro Plan ($40/month) is designed for enterprise needs, offering custom integrations and dedicated API access.
This integration provides a unified view, helping you demonstrate how quality backlinks contribute to SEO success and, ultimately, business growth.
Setting Up Automated Workflows and Scheduling
Once your data is centralized, the next step is to streamline workflows and scheduling. This ensures reports are timely and free from errors. By leveraging scalable report templates and automation, you can significantly cut down on manual work – reducing reporting time from around 8 hours per client to just minutes.
The backbone of automated workflows is API integration. Instead of manually downloading CSV files from platforms like Google Search Console or GA4, connect your reporting tools directly through their APIs. This setup not only provides real-time data updates but also eliminates the typical 3% to 5% error rate found in manual data entry. To make year-over-year comparisons easier and bypass data retention limits, store your data in warehouses like Google BigQuery.
Set up a schedule for weekly tactical reports and monthly executive summaries. For example, deliver reports on Monday mornings to review the previous week’s performance. Configure automated charts to include comparisons such as “Last 30 Days vs. Previous 30 Days” to account for seasonal trends and provide better context.
Additionally, implement tripwires to alert you to critical issues – like a 20% drop in organic traffic or a spike in 404 errors – so you can address problems as they arise instead of waiting for the next report cycle. At the start, manually cross-check traffic numbers and keyword positions to ensure they align with live data in GA4 and Google Search Console. This early validation helps catch any configuration errors before they escalate. These steps integrate well with batch processing, especially for agencies managing multiple clients.
Batch Generation and Scheduling
For agencies handling several clients, batch processing is a game-changer. Group clients by their reporting schedules and automate report generation 2–3 days before the delivery deadline. This extra time allows for final reviews and catching any data anomalies before reports land in client inboxes. Scheduling reports to run overnight can also help manage high volumes without impacting system performance during peak hours.
Automation can reduce the time spent on manual reporting by as much as 95%, cutting the process down to about 6–8 minutes per report. This efficiency enables agencies to grow without needing to hire more staff.
To ensure continuity, authenticate API connections using your agency’s main Google account rather than individual employee accounts. This avoids access issues during team changes. Configure tools to deliver reports directly to Slack or email as PDFs or dynamic links, depending on where stakeholders are most active. Include a short, automated summary in the email body to highlight key wins, so stakeholders can quickly understand the report’s main takeaways without opening the full document.
Validating Data Accuracy and Consistency
While automation saves time, it’s only as good as the data it delivers. Accuracy is critical. A 2025 survey of 347 digital agencies revealed that 23% had experienced client disputes over data accuracy, leading to an average loss of $8,400 in time and strained relationships. To avoid this, set clear variance standards. Industry guidelines consider a ±2% variance excellent, ±5% acceptable for non-critical metrics, and anything over 10% a sign of a deeper issue that needs investigation.
“Imagine presenting a report showing 15% traffic growth, only for your client to discover through their own Analytics that growth was actually 8%. Even small discrepancies can erode trust.”
Perform monthly spot checks on 2–3 key metrics by comparing them to source data from Google Search Console or GA4. Ensure that both your reporting tool and the source data are using the same timezone settings to avoid discrepancies caused by “date boundary” issues. Also, confirm whether your tool excludes bot traffic or branded search terms, as inconsistent filtering can lead to significant differences in reported metrics.
In January 2026, Reportr conducted an accuracy test across 12 client websites, comparing automated reporting tools with manual data pulls. Conducted on February 3, 2026 (72 hours after month-end), the test revealed that while GA4 data was generally aligned across platforms, Google Search Console data showed notable variances. Reportr achieved the highest accuracy (99.7%) by using direct API connections, while SEMrush showed a 7.3% variance due to its focus on rank tracking over comprehensive reporting.
To maintain reliability, regularly check API connection statuses to prevent data gaps. For high-stakes situations like contract renewals or presentations to C-level executives, manually verify key metrics – even if automation has been consistently accurate. This extra step ensures confidence when it matters most.
Maintenance and Optimization
Automation isn’t a “set it and forget it” solution. Regular upkeep ensures your SEO reports stay accurate and relevant as your business evolves.
Monitoring and Updating Data Sources
It’s important to monitor your data sources consistently. For instance, check API connection statuses weekly to spot and fix expired OAuth tokens before they cause data gaps. Many tools have limited data retention, so using long-term storage solutions like BigQuery can help preserve historical data.
Create a simple review schedule to stay on top of potential issues. Dedicate 30 minutes each week to reviewing anomaly alerts and tracking 404 error spikes. Once a month, spend around 90 minutes manually cross-checking key metrics with GA4. This routine helps you catch configuration errors early, especially after platform updates that might alter API responses.
Set automated alerts for significant changes, such as a 20% drop in organic traffic or rankings. This proactive approach prevents small issues from snowballing into bigger problems. With only 24% of marketers feeling confident in their attribution models, documenting your data sources and calculation methods is crucial. This ensures everyone interprets metrics consistently, even as your tech stack evolves.
Review and refine your KPIs every quarter. Eliminate vanity metrics that don’t contribute to decision-making, and introduce new KPIs that align with major product launches or shifting business goals. Annotate significant site changes or algorithm updates in your reports to provide context for traffic fluctuations. This added layer of insight turns raw data into actionable intelligence.
Once your data sources are verified and alerts are set, the next step is scaling your reporting templates to accommodate growth.
Scaling Templates for Growing Needs
With your data accuracy under control, focus on adapting your reporting templates to handle more clients or expanded needs. Create master templates that automatically populate with client-specific data. This way, a single update to the master template reflects across all reports instantly. For mid-sized agencies, this shift from manual to automated reporting can save up to 40 hours of work each week.
Start with a universal KPI layer – five to seven key metrics like organic sessions, keyword rankings, backlink quality, and Core Web Vitals. Then, add modular sections tailored to specific goals. For example, include local SEO metrics for brick-and-mortar businesses or conversion tracking for e-commerce clients. This modular structure allows you to scale without rebuilding templates from scratch for each new account.
To meet the needs of different stakeholders, create tiered reports. Executives benefit from high-level scorecards that highlight revenue impact, while technical teams require more detailed data like crawl reports and page speed metrics. Use access controls to ensure each team member only sees what’s relevant – for example, content writers can focus on traffic trends without being overwhelmed by technical details.
In addition to scheduled monthly PDFs, provide “always-on” dashboards – interactive, live links that clients can access anytime without waiting for manual updates. This approach reduces ad-hoc reporting requests and keeps everyone aligned on performance. Agencies using automated reporting systems report 40% higher client retention rates and see a 35% boost in average project values. Consistent, accessible data builds trust and strengthens client relationships.
| Review Frequency | Focus Area | Key Actions |
|---|---|---|
| Weekly | Operational Triage | Check anomaly alerts, 404 spikes, and daily keyword volatility |
| Monthly | Strategic Alignment | Cross-verify data accuracy, remove unused charts, and update summaries |
| Quarterly | Governance & Scaling | Update data dictionaries, adjust KPIs for new goals, and review ROI |
Conclusion
Switching to automated SEO reporting transforms a time-consuming task into a strategic advantage. Did you know the average digital marketing agency spends 12–15 hours each month on manual reporting? That’s valuable time that could be better spent on strategy, content creation, and optimization. By following the steps outlined in this guide, you could save up to 95% of that time.
But it’s not just about saving hours. White-label reporting can also boost client relationships. Agencies using professional reporting systems report 40% higher client retention rates and see 35% higher average project values. Plus, direct API integrations eliminate the 3–5% error rate common in manual workflows, ensuring your data is accurate and actionable. Together, these benefits pave the way for a seamless, efficient reporting process.
Here’s how to make the most of automation:
- Choose platforms with direct OAuth connections.
- Build scalable templates that focus on core KPIs, while allowing for client-specific adjustments.
- Set up automated workflows to deliver reports on time.
- Regularly monitor alerts and key metrics to stay ahead.
For integrating high-quality backlink data into your automated reports, tools like 3Way.Social offer AI-driven domain matching and permanent do-follow links. Their vetted network and quality filters ensure your link-building efforts lead to measurable outcomes.
“The goal of automating SEO reporting is not to stop thinking about your clients’ data. It’s to stop doing the mechanical work that prevents you from thinking about it.” – Marc Caposino, CEO, Fusedash
Automation isn’t a one-and-done deal – it requires regular updates and reviews. By maintaining consistent practices and refining your KPIs and templates, your agency can keep delivering meaningful insights. This frees up your team to focus on what truly matters: achieving impactful SEO results for your clients.
FAQs
What should I automate first in my SEO reporting?
The starting point for automating SEO reporting is data collection. By integrating essential tools – such as Google Search Console, Google Analytics, or rank trackers – via APIs, you can automatically pull in the necessary data. This approach not only saves time but also minimizes errors and removes the hassle of manual exports.
Once you’ve automated data collection, the next focus is on standardizing your reporting process. Set up consistent KPI templates, design easy-to-read dashboards, and establish regular schedules for report delivery. This ensures your reporting stays efficient and organized.
How do I keep GA4 and Search Console numbers consistent?
To keep your GA4 and Search Console data aligned, it’s important to integrate Search Console data with GA4. This helps you connect search visibility metrics with on-site user behavior. Start by ensuring both tools are properly set up, with accurate tracking, filters, and date ranges in place. Regularly cross-check manual data pulls against automated reports to spot any inconsistencies and make adjustments as needed. This process helps maintain data accuracy and provides dependable insights for making informed decisions.
Do I really need BigQuery for automated SEO reports?
No, you don’t always need BigQuery for automated SEO reports. Tools like Looker Studio can connect directly to platforms such as Google Search Console and GA4, allowing you to create real-time dashboards without relying on BigQuery. That said, if your reporting requires advanced analysis – like linking SEO metrics to broader business outcomes – BigQuery can be incredibly useful. Its ability to manage complex data pipelines and run custom queries makes it a strong choice for more sophisticated needs. Ultimately, it all comes down to the complexity of your reporting requirements.