Last Updated on June 1, 2026 by Becky Halls
Learning to automate multi-channel SEO reports saves time, reduces errors, and improves data accuracy. Instead of spending hours manually collecting and formatting data, automation tools consolidate metrics from platforms like Google Search Console, GA4, and backlinks monitor tools into a single dashboard. This helps you focus on analysis and strategy rather than repetitive tasks. Key benefits include:
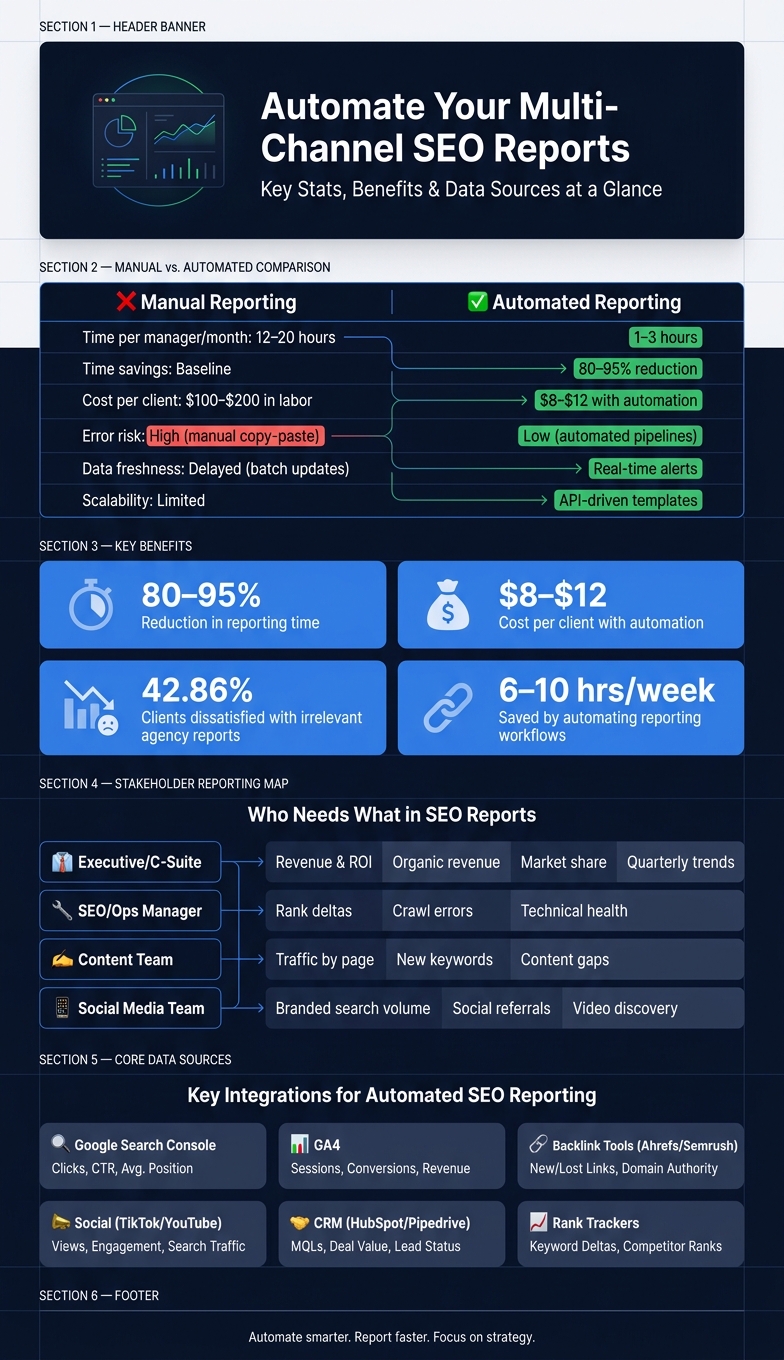
- Time savings: Automation cuts reporting time by 80–95%.
- Error reduction: Eliminates mistakes from manual copy-pasting.
- Real-time insights: Alerts flag issues like ranking drops or technical SEO issues immediately.
- Customizable reports: Tailor metrics for different stakeholders (e.g., executives, SEO teams).
To get started, connect tools like Looker Studio, AgencyAnalytics, or Supermetrics to your data sources. Standardize KPIs, align metrics with business goals, and automate report delivery for consistent updates. Add alerts for performance drops, and include context to explain anomalies. Scaling your system with APIs and templates ensures efficiency as your SEO efforts grow.
Multi-Channel SEO Reporting: Manual vs. Automated at a Glance
Planning Your Multi-Channel SEO Reporting Framework
Defining Reporting Goals and Stakeholders
Before diving into tools and configurations, take a step back and define what you want your reports to achieve. What questions do they need to answer? What does success look like? As Scott Gingrich, Chief Marketing Strategist at GravityStack Marketing, explains:
“Our clients care most about rank. For us, that’s only part of the story; we get them to also look at how rank translates to traffic and conversions.”
Different stakeholders in your organization have different priorities when it comes to SEO reporting. For instance, a C-suite executive will want to see how SEO impacts revenue and overall business performance, while an SEO manager is more focused on technical metrics like crawl errors and ranking changes. Meanwhile, the content team is primarily interested in traffic trends and keyword opportunities. Trying to create one report for all these audiences often results in a report that satisfies no one.
| Stakeholder Role | Primary Focus | Key Metrics to Include |
|---|---|---|
| Executive / C-Suite | Revenue & ROI | Organic revenue, market share, trend arrows, quarterly progress |
| SEO / Ops Manager | Technical & Granular | Rank deltas, crawl errors, technical health, specific task lists |
| Content Team | Page Performance | Traffic by page, new keywords ranking, content gaps |
| Social Media Team | Cross-channel Signal | Branded search volume, social referrals, video search discovery |
During onboarding, ask stakeholders how they prefer to receive information. Some may want a concise summary, while others might expect detailed tables and charts. These conversations can save you from creating reports that go unread – a common issue, with 42.86% of digital marketing clients expressing dissatisfaction with their agency’s reports due to a lack of business relevance. Setting clear objectives at this stage ensures your reports align with each audience’s needs.
Choosing Channels and KPIs to Track
Once you understand your audience, the next step is to align your Key Performance Indicators (KPIs) with their business goals. For example, if the goal is generating leads, focus on metrics like MQLs and cost per lead. If brand awareness is the priority, metrics like branded search volume and share of voice should take precedence over general traffic numbers.
Every report should include a core set of metrics that apply universally, such as:
- Organic sessions
- Keyword rankings (top 3, top 10, top 100)
- Backlink acquisition
- Technical health
From there, add metrics tailored to specific business needs. For example, local businesses might need local pack rankings, while e-commerce companies should track organic revenue and return on ad spend (ROAS). To avoid misleading fluctuations, use 7–14 day keyword ranking averages instead of daily data, which can be overly volatile.
It’s also crucial to separate organic traffic from other sources like social, direct, and referral traffic. Combining these can lead to errors, such as crediting a viral social post to SEO efforts. These inaccuracies can erode confidence in your reports over time. By defining your goals and selecting precise KPIs, you’ll be ready to integrate them into a unified reporting framework.
Structuring an Integrated Reporting Model
A well-structured reporting model follows a logical flow: Acquisition → Behavior → Conversions. This framework answers the key questions stakeholders care about – how users found your site, what actions they took, and what business outcomes resulted.
On the technical side, consistency is critical. Standardize date formats (MM/DD/YYYY), use USD for currency, and apply strict UTM naming conventions like [Channel]_[Type]_[Audience] across all campaigns. Without these standards, data from different sources won’t align properly, leading to time wasted on troubleshooting instead of analysis. Additionally, establish a “source of truth” for each KPI – use GA4 for sessions, Google Search Console for clicks, and avoid mixing data sources in a single trend line.
Finally, include a context layer in your reports. This could be a section where account managers add notes to explain anomalies, such as “site migration started 05/07/2026.” Context like this helps stakeholders understand the story behind the numbers and prevents automated alerts from misclassifying planned changes as issues.
sbb-itb-88880ed
Integrating Data Sources for Automated SEO Reports
Setting Up Core Analytics Tools
Start with the essentials: Google Search Console (GSC) for search performance data and Google Analytics 4 (GA4) for insights into on-site behavior and revenue attribution. Both tools offer free, native connectors for Looker Studio, ensuring automatic updates and eliminating the hassle of manual CSV uploads.
If you encounter URL mismatches, use a calculated field to normalize formats. For example, you can apply a formula like REGEXP_REPLACE(Page, 'https://example\\.com', '') to align GSC and GA4 data seamlessly in Looker Studio. For local SEO efforts, integrate Google Business Profile data to track map pack visibility alongside organic search metrics.
To manage expectations around data freshness, include a data refresh timestamp in your dashboard. Keep in mind that GSC data typically lags by 2–3 days, while GA4 updates within 24–48 hours. Once these core tools are connected, you can expand your reporting by incorporating additional marketing and CRM platforms.
Adding Marketing and CRM Platforms
To create a complete picture of your SEO performance, integrate data from marketing and CRM channels. For social platforms like TikTok and YouTube, tools such as Metricool or Supermetrics (priced between $30 and $120/month) can pull metrics like views, engagement rates, and search-source traffic directly into Looker Studio.
For CRM platforms, options like HubSpot or Pipedrive offer native integrations with tools like AgencyAnalytics, or you can set up custom API workflows using n8n. This allows you to track metrics such as lead quality, marketing-qualified leads (MQLs), and deal values alongside your SEO data.
Automating your reports shifts your focus from repetitive tasks to strategic analysis. As Marc Caposino, CEO of Fusedash, explains:
“The goal of automating SEO reporting is not to stop thinking about your clients’ data. It’s to stop doing the mechanical work that prevents you from thinking about it.”
If your strategy includes paid media, such as Google Ads or Meta Ads, integrating these data sources into the same dashboard lets you compare organic and paid performance side by side. This comprehensive view helps decision-makers better understand overall ROI. Next, you can round out your reporting by adding link-building metrics.
Connecting Link-Building Metrics
Link-building data is a crucial component of SEO reporting. Use APIs from tools like Ahrefs or Semrush to pull metrics such as new and lost links, referring domain growth, and domain authority trends. Overlaying link acquisition dates with traffic and ranking trends from GA4 and GSC transforms raw data into meaningful insights.
If you’re using tools like 3Way.Social for ABC link exchanges and acquiring permanent do-follow backlinks, treat those placements as trackable events. Record acquisition dates and referring domains in your reporting layer, then analyze their impact by comparing them against GA4 organic sessions and GSC ranking trends. This approach makes it easier to show how specific link-building activities contribute to traffic growth and ranking improvements.
One thing to note: backlink tools usually refresh their data 2–3 times per week, and new links may take 5–7 days to appear in automated reports. Factor in this delay when presenting your link-building results.
| Data Source | Key Metrics | Integration Method |
|---|---|---|
| Google Search Console | Clicks, impressions, CTR, average position | Native connector (free) |
| GA4 | Sessions, conversions, revenue, engagement rate | Native connector (free) |
| Social (TikTok/YouTube) | Views, engagement rate, search-source traffic | Metricool / Supermetrics |
| CRM (HubSpot/Pipedrive) | Lead status, deal value, MQLs/SQLs | Native integration / n8n |
| Backlink Tools | New/lost links, referring domains, domain authority | API / Google Sheets bridge |
| Rank Trackers | Keyword position deltas, competitor ranks | API / Google Sheets bridge |
Building and Automating the Reporting Workflow
Designing the Report Structure
Once your data sources are connected, the next step is designing a report that effectively communicates key metrics to the right stakeholders. A practical approach involves layering your report structure. Start with an executive summary that highlights revenue impact, key successes, and any critical challenges. Follow this with channel-specific sections, such as trends in organic traffic, keyword performance, and technical health as part of your step-by-step SEO guide. Wrap it up with a backlink profile section.
If you’re using 3Way.Social, include a subsection dedicated to tracking do-follow links, acquisition dates, referring domains, and authority trends. Pair these insights with Google Search Console (GSC) ranking data to directly link your link-building efforts to measurable ranking changes.
Tailor your report to the priorities of your audience. Different stakeholders care about different metrics, so segment the report accordingly. Here’s an example table to guide your structure:
| Report Section | Key Metrics | Primary Audience |
|---|---|---|
| Executive Summary | Revenue impact, ROI, top wins | C-suite / clients |
| Organic Traffic Trends | Sessions, MoM/YoY growth | Marketing managers |
| Keyword Performance | Rank deltas, CTR, impressions | SEO / content teams |
| Technical Health | Core Web Vitals, crawl errors | Dev / ops teams |
| Backlink Profile | New/lost links, referring domains | SEO / link-building teams |
| Conversion Attribution | Organic revenue, cost-per-lead | Marketing / finance |
Once the structure is finalized, the next step is automating the data refresh and delivery processes for real-time insights.
Automating Data Refresh and Delivery
With your report structure ready, automate its delivery to save time and reduce manual work. Tools like Looker Studio make this easy with their Schedule email delivery feature. You can set reports to be sent at regular intervals – weekly for active campaigns or site migrations, and monthly for ongoing retainers.
To improve dashboard performance, use Looker Studio’s Extract Data connector. This creates data snapshots, ensuring faster load times by avoiding live API queries every time someone accesses the report. For larger datasets, especially those combining CRM and SEO data, load the data into BigQuery first. This not only speeds up queries but also helps you avoid hitting API rate limits.
“The static report is a dead document the moment it’s exported, and CMOs stop reading it after the first month. The fix is a Looker Studio + BigQuery pipeline.” – Niko Alho, SEO & AI Automation Architect
Always provide a live dashboard link alongside any scheduled PDFs. While PDFs are useful for archiving, they quickly become outdated. A live link allows stakeholders to explore and filter data in real-time, such as by date range or channel, without waiting for the next reporting cycle. Once delivery is automated, set up alerts to catch critical issues as they arise.
Setting Up Alerts and Thresholds
Automated alerts turn your dashboard into a proactive monitoring tool. Set alerts for key metrics like a >15–20% week-over-week drop in organic clicks, a drop of more than five ranks in keyword positions, new crawl errors, or site downtime.
In Looker Studio Pro, you can configure email alerts based on thresholds. These alerts trigger automatically when a metric crosses a predefined limit, eliminating the need for constant manual checks. For uptime monitoring, free tools like Uptime Robot can send instant notifications via Slack or email when your site encounters an HTTP 5xx error. Add traffic-light conditional formatting to your scorecards (green for on-target, red for below-target) to make critical issues stand out immediately.
When setting up alerts, account for the 2–3 day delay in GSC data. This prevents false alarms caused by data lag instead of actual performance changes.
Optimizing and Scaling Your Reporting System
Validating Data Accuracy
Automated systems can sometimes produce inaccurate data due to UTM inconsistencies. For instance, if one campaign is tagged email_newsletter and another is tagged Email-Newsletter, your system might treat them as entirely separate channels. To avoid this, standardize naming conventions across all teams before scaling up. Additionally, decide which platform will serve as the authoritative source for each metric. Discrepancies between tools like Google Search Console (GSC) and GA4 are common, so having a clear standard is essential.
When it comes to keyword rankings, focus on 7–14 day rolling averages rather than daily snapshots. This approach smooths out the natural volatility of search engine results pages (SERPs).
To ensure seamless reporting, set up automated health checks for your API connections. These checks can catch broken integrations early, preventing empty reports from being sent to clients. A blank chart with no explanation can erode trust far more than an error message. Once you’ve nailed down data accuracy, the next step is to improve your reports based on user feedback.
Refining Reports Based on Feedback
Even with accurate data, reports can fall flat if they lack context. Research shows that nearly half of digital marketing clients are unhappy with the reports they receive, often because the data provided doesn’t tell a clear story or explain its significance. The solution isn’t adding more data; it’s presenting the right data in a meaningful way.
“Clients want context-rich reporting that explains what metrics mean, why they matter, and whether performance is good or bad.” – AgencyAnalytics Customer Research
Focus each report on 5–7 key metrics that directly influence decision-making. Include a concise, plain-language summary that explains what has changed and why. Use annotations to flag anomalies – like a planned dip in traffic due to a site migration – so they don’t come across as unexplained issues. Tailor your reports for different audiences: executives care about revenue and ROI, while SEO managers need details like ranking changes and crawl errors.
| Stakeholder Role | Primary Focus | Recommended Sections |
|---|---|---|
| Executive / C-Suite | Revenue & ROI | Traffic growth %, ROI, competitive standing |
| SEO / Ops Manager | Technical & Granular | Rank deltas, crawl errors, action items |
| Content Team | Page Performance | Traffic by page, new keywords, content gaps |
Scaling as Your SEO Efforts Grow
As your SEO campaigns grow, scaling your reporting system becomes essential for maintaining efficiency. Once your client base or campaign scope expands, the challenge shifts from data collection to managing the reports themselves. Create a master template that adapts dynamically, showing only the sections relevant to each client. For example, ecommerce metrics should remain hidden for clients without GA4 purchase tracking. Use dynamic date ranges, such as “last 30 days”, to automate updates without requiring manual adjustments every cycle.
If your link-building program expands, consider integrating advanced off-page data directly into your reports. Tools like 3Way.Social can provide structured metrics – like acquisition dates for do-follow links, referring domain authority, and diversification signals – that feed directly into your dashboard. This ensures all your SEO data, from off-page performance to organic traffic, is centralized rather than scattered across multiple tools.
“SEO teams that automate their reporting workflows save an average of 6–10 hours per week while improving decision-making speed by a significant margin.” – SEOAuto
Scaling your reporting system isn’t just about saving time – it’s about cutting costs. Manual reporting can cost $100–$200 in labor per client, while automation reduces that to $8–$12 per client. Over time, this adds up, making an investment in API-driven, scalable reporting systems one of the smartest moves for long-term growth.
How I Automated SEO Reports and Emails Using n8n (No Dev Skills Needed)
Conclusion: Key Takeaways for Automating Multi-Channel SEO Reports
Automating multi-channel SEO reporting can revolutionize how you manage your time and resources. Instead of spending 12–20 hours each month on manual reporting per manager, automation slashes that time by an impressive 80–95%. This means more time to focus on strategy and delivering value to clients.
To make automation work for you, start with the basics: standardize your data and rely on flexible templates that can grow alongside your business. These steps ensure that your reporting process remains efficient and scalable.
Once the groundwork is set, take it a step further by integrating off-page SEO data directly into your dashboards. Tools like 3Way.Social simplify this by combining do-follow acquisition dates, domain authority, and diversification metrics with organic traffic and ranking data. This eliminates the need for manual cross-referencing and gives you a comprehensive view of your SEO efforts.
FAQs
Which KPIs should I standardize across channels?
To effectively measure performance, hone in on 8 to 15 core KPIs that directly align with your business objectives. These KPIs should allow for meaningful comparisons across different channels. Make sure to standardize critical elements like conversions, attribution models, and campaign naming conventions to avoid discrepancies.
Key metrics to prioritize include:
- Customer Acquisition Cost (CAC): Helps track how much you’re spending to acquire each new customer.
- Return on Ad Spend (ROAS): Measures the revenue generated for every dollar spent on advertising.
- Total Marketing-Attributed Revenue: Provides a clear picture of how much revenue can be linked back to your marketing efforts.
By focusing on these metrics, you can ensure your data remains consistent and actionable across all marketing channels.
How do I reconcile mismatched GA4 and GSC numbers?
It’s common to see a 10%-25% difference between numbers in GA4 and Google Search Console (GSC). Here’s why: GSC tracks clicks from search results, while GA4 measures sessions after a page fully loads. This tracking difference naturally leads to discrepancies.
To minimize these gaps, here are some tips:
- Check domain settings: Ensure your domains are configured consistently across both platforms.
- Align time zones: GSC operates on Pacific Time, so make sure GA4’s time zone matches.
- Standardize URL formats: Remove inconsistencies like protocols (http/https) or trailing slashes in URLs.
If you’re using Looker Studio to combine data, double-check that date ranges, filters, and dimensions are aligned across both tools. This helps ensure you’re comparing apples to apples.
What alerts should I set to catch SEO issues early?
To stay ahead of SEO problems, it’s smart to set up alerts that notify you when key metrics take a hit. Here’s what to focus on:
- Organic traffic drops: Keep an eye out for a 15–20% decrease over the course of a week. This could signal a bigger issue.
- Keyword ranking losses: Sudden drops in rankings for important keywords are worth investigating right away.
- Impression declines: A noticeable dip in impressions might indicate visibility issues in search results.
In addition to performance metrics, it’s crucial to monitor your site’s technical health. Set alerts for:
- Crawl errors: These can prevent search engines from accessing your pages properly.
- Indexation changes: Sudden shifts in indexed pages could point to problems with your site structure or content.
- Core Web Vitals regressions: Any decline in these metrics can hurt user experience and rankings.
Lastly, don’t forget your backlink profile. Track changes like newly acquired or lost links and shifts in domain authority. These factors play a big role in maintaining a solid SEO foundation.